
btop
Monitor CPU, memory, disk, network, and processes with interactive graphs and detailed statistics. Fast, responsive TUI built in C++ for Linux, macOS, and BSD systems.
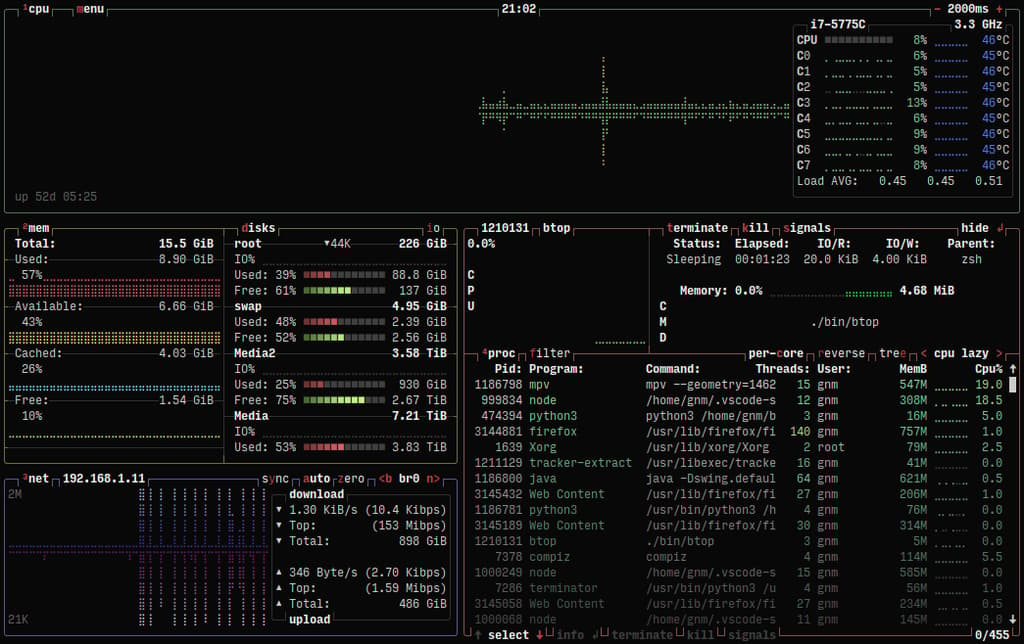
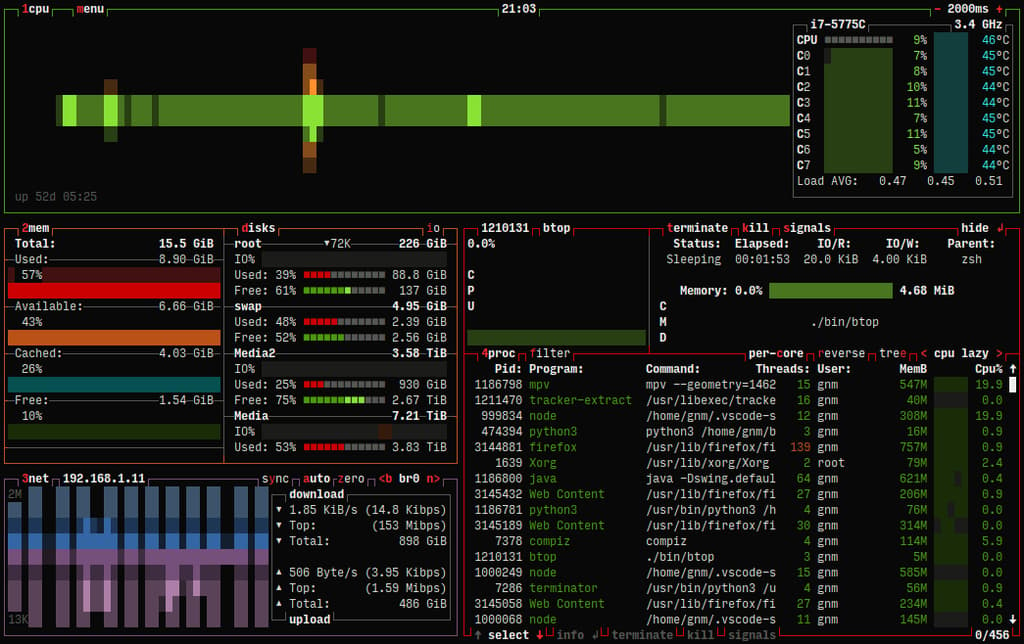
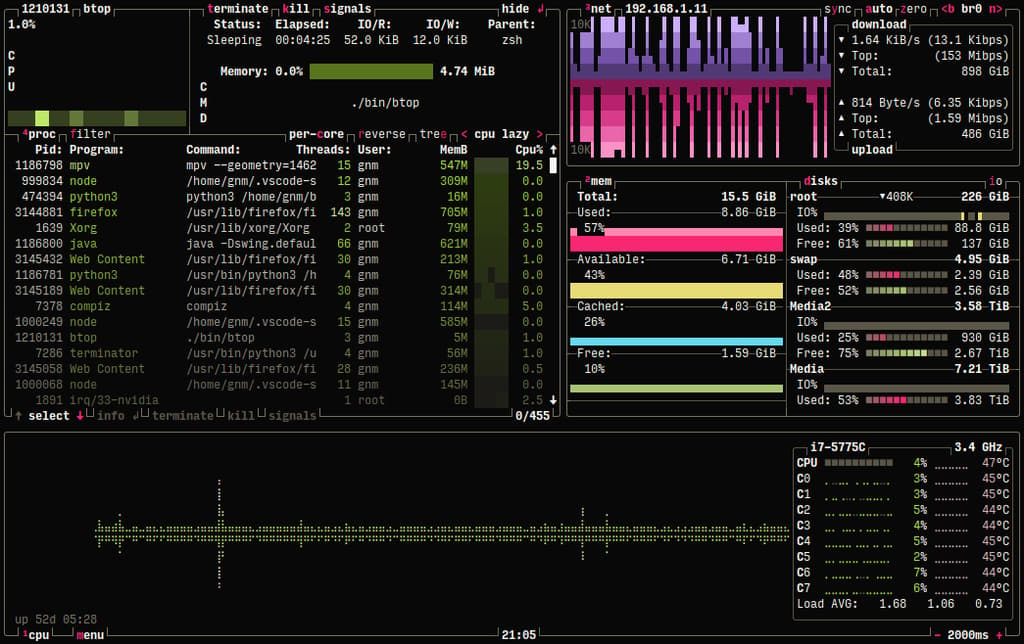
Get instant visibility into your system's performance with a terminal-based resource monitor that displays real-time data through clear, interactive graphs. Whether you're tracking down performance bottlenecks or monitoring resource-heavy applications, this tool provides the information you need at a glance.
Key capabilities include:
- Comprehensive monitoring - Track CPU, memory, disk I/O, network activity, and running processes simultaneously
- Visual clarity - Interactive graphs with autoscaling for network usage and detailed I/O activity visualization
- Process management - Filter processes, view them as a tree structure, and identify resource consumers quickly
- Battery awareness - Built-in battery meter for laptop users
- High performance - Written in C++ for responsive, lightweight operation even under heavy system load
- Cross-platform support - Runs on Linux, macOS, FreeBSD, NetBSD, and OpenBSD
The responsive TUI interface makes navigation intuitive, while the detailed graphs help you understand system behavior over time. Perfect for developers, system administrators, and anyone who needs quick access to performance metrics without leaving the terminal.
Install
Brew
$ brew install coreutilsFeatures
Config fileTrue color
Terminal features
GPU accelerated
Media

Pros
4- Monitors CPU, memory, disk, and network usage.
- Provides interactive graphs and detailed statistics.
- Offers GPU monitoring capabilities.
- Supports multiple operating systems including Linux, macOS, and BSD.
Related tools
Alternatives
15
viddy– Modern watch command with time travel and vim keybindings

below– View and replay historical Linux system performance data

s-tui– Real-time CPU monitoring and stress testing in your terminal

bottom– Real-time system monitoring with full customization for your terminal

csysdig– Deep system visibility with native container support

htop– Monitor system processes with real-time interactive control
Works with
17
snitch– Monitor network connections live with an intuitive interface

k9s– Navigate and manage Kubernetes clusters directly from your terminal

kmon– Manage and monitor Linux kernel modules from your terminal

llmfit– Find which LLMs run on your hardware in seconds

goaccess– Real-time web log analysis in your terminal or browser

wtf– Monitor systems and services directly from your terminal
Categories:
Activity score
95/100
Stars
34,972Forks
1,210Latest version
v1.4.7Last commit
4 days agoFirst release
5 yearsLanguage
C++License
Apache-2.0
Auto-fetched .
Recent releases
- 6 months ago
- 10 months ago
- 1 year ago
- 1 year ago
- 1 year ago
Similar to btop