
gdb-dashboard
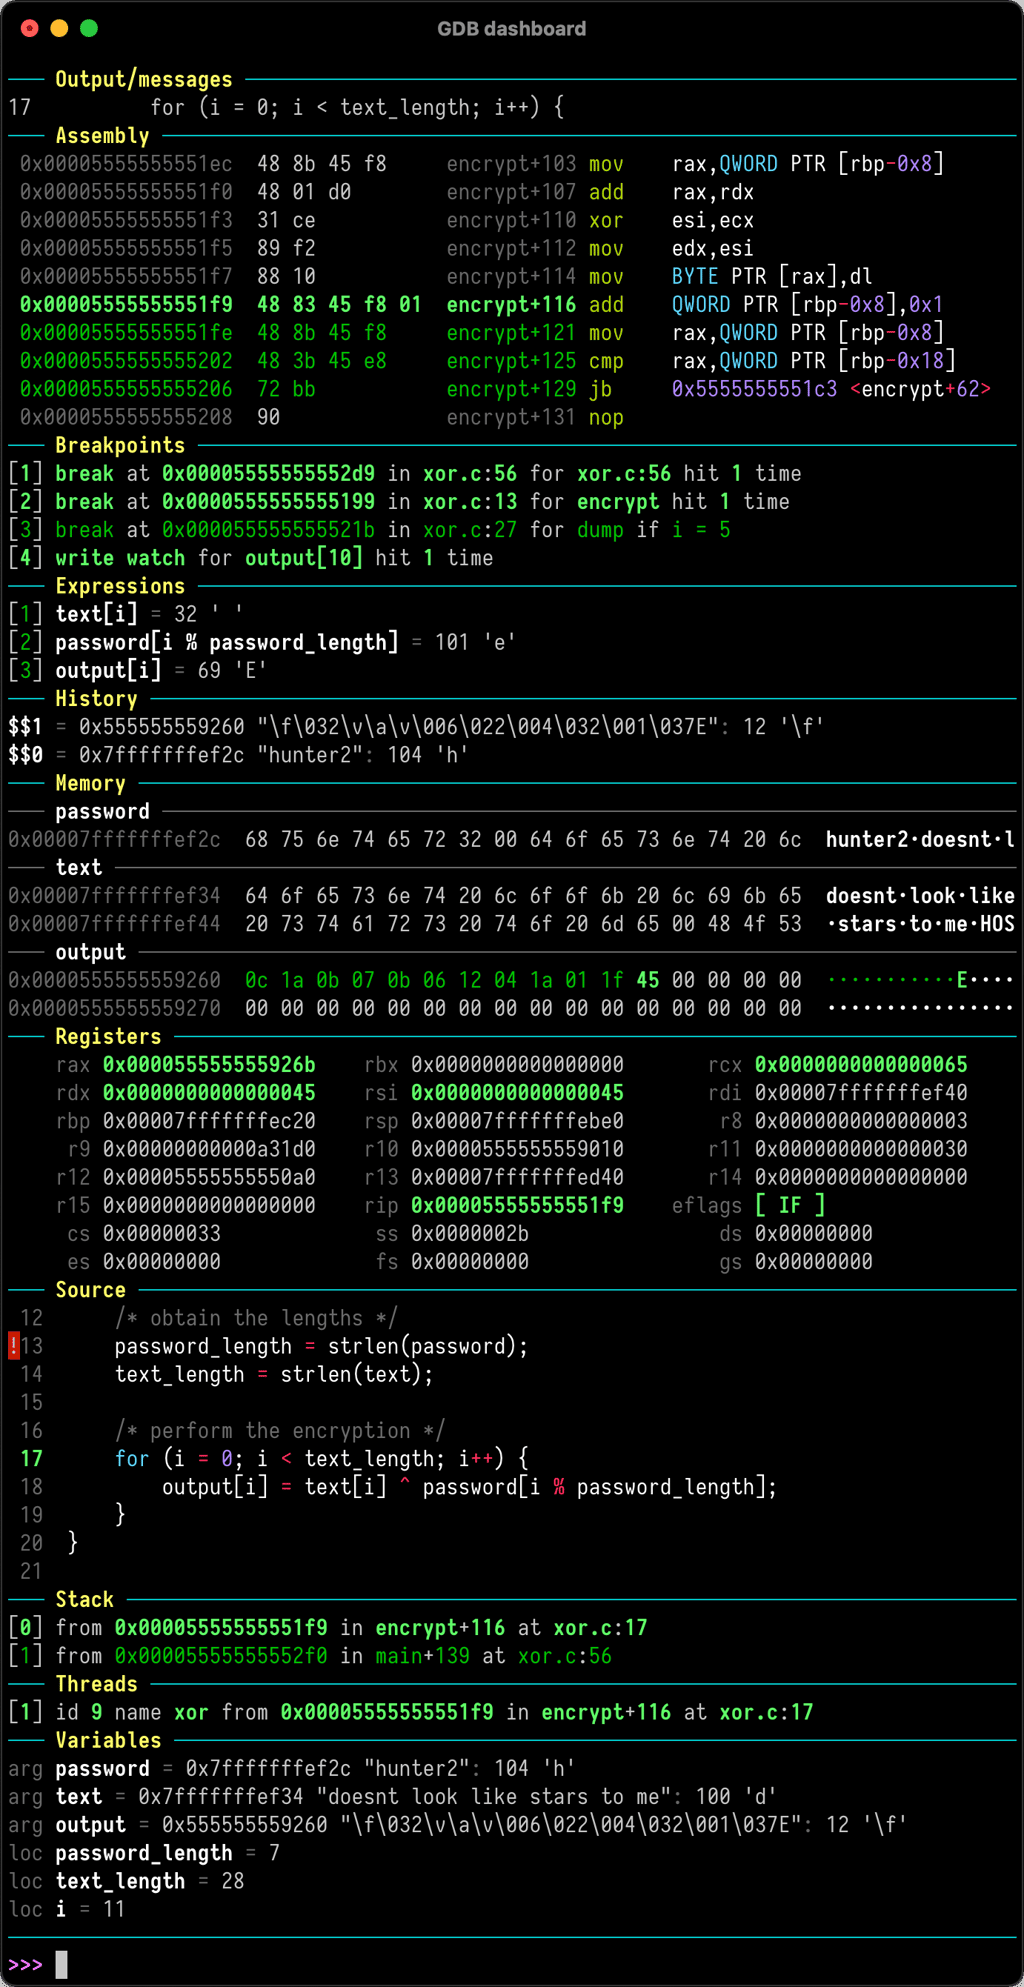
Modular GDB dashboard showing real-time program information. Reduces debugging commands needed and keeps focus on control flow with automatic display updates.
GDB dashboard transforms your debugging experience by providing a modular visual interface that displays relevant information about your program automatically. Instead of repeatedly typing GDB commands to inspect program state, the dashboard shows everything you need at a glance whenever your program stops.
The tool works as a standalone .gdbinit file using GDB's Python API, making it easy to install and use without modifying your existing workflow. No GDB commands are redefined—all features are accessed through the main dashboard command, keeping your debugging environment clean and predictable.
Key capabilities include:
- Automatic display updates whenever the debugged program stops
- Modular interface showing program status, variables, and execution context
- Syntax highlighting support with optional Pygments integration
- Reduced command overhead letting you focus on control flow rather than status checks
- Easy installation by placing a single file in your home directory
The dashboard appears automatically during debugging sessions, eliminating the need to manually request status information. Optional Pygments installation adds syntax highlighting for better code readability. Whether you're debugging complex applications or learning how programs execute, this tool significantly reduces the friction of inspecting program state during development.
Install
$ pip install pygmentsFeatures
Media
Pros
4- Modular interface for GDB
- Reduces GDB commands needed
- Automatic display updates
- Focus on control flow
Related tools

Tags:
Activity score
74/100
Stars
12,267Forks
820Last commit
3 months agoFirst release
11 yearsLanguage
PythonLicense
MIT
Auto-fetched .
Similar to gdb-dashboard