
youplot
Command-line tool that renders boxplots, histograms, scatter plots, line charts, and more directly in the terminal from CSV and TSV files.
YouPlot brings data visualization directly to your terminal, eliminating the need for graphical interfaces or external tools. Whether you're analyzing datasets on a remote server or prefer working in the command line, this tool delivers immediate visual feedback for your data.
Key capabilities include:
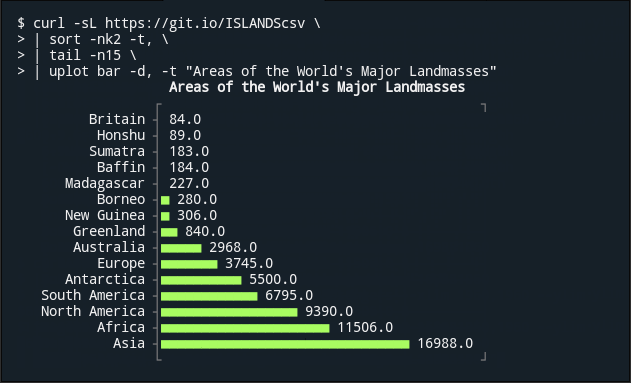
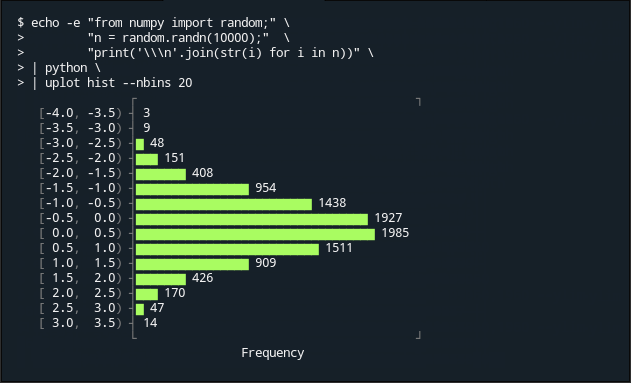
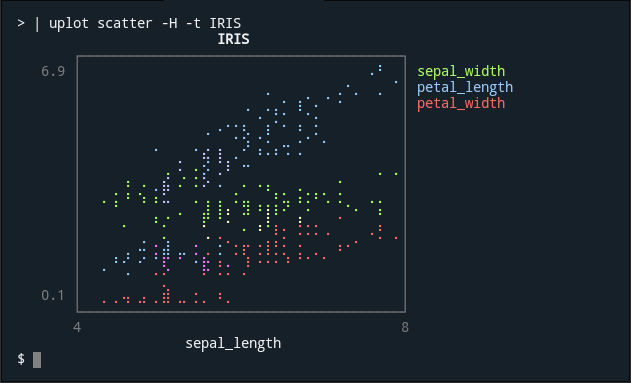
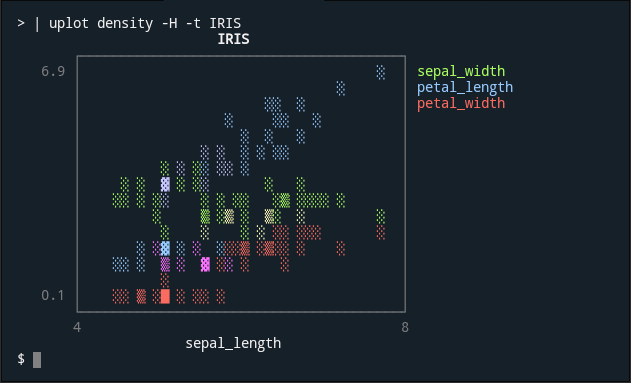
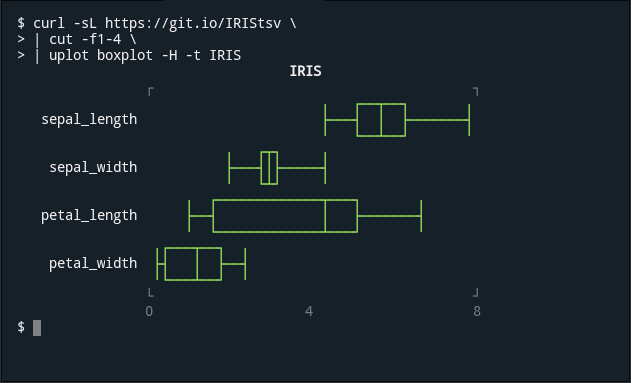
- Multiple plot types: barplots, histograms, line charts, scatter plots, density plots, and boxplots
- Flexible input: Works seamlessly with CSV, TSV, and piped data from other commands
- Unix-friendly: Integrates naturally into shell pipelines for data processing workflows
- Customization options: Control plot dimensions, titles, colors, axis limits, and data formatting
- Real-time visualization: Progressive mode for streaming data analysis
- No dependencies: Lightweight and portable across different environments
Simply pipe your data or specify files, choose your plot type, and watch your analysis appear instantly. Perfect for exploratory data analysis, quick sanity checks, and environments where graphical tools aren't available. The tool handles headers, custom delimiters, and multi-series data with straightforward command-line options.
Install
Brew
$ brew install youplotFeatures
JSON outputScriptable
Media
Pros
4- Renders various plot types directly in the terminal
- Supports CSV and TSV file formats
- Can output data to stdout for piping
- Multiple installation methods available
Cons
1- The 'count' command can be slow for large datasets
Related tools



Categories:
Similar to youplot